2 Introduction and Overview
2.1 What is Data Science?
Data science encapsulates the interdisciplinary activities required to create data-centric artifacts and applications that address specific scientific, socio-political, business, or other questions.
Let’s look at the constiuent parts of this statement:
2.1.1 Data
Measureable units of information gathered or captured from activity of people, places and things.
2.1.2 Specific Questions
Seeking to understand a phenomenon, natural, social or other, can we formulate specific questions for which an answer posed in terms of patterns observed, tested and or modeled in data is appropriate.
2.1.3 Interdisciplinary Activities
Formulating a question, assessing the appropriateness of the data and findings used to find an answer require understanding of the specific subject area. Deciding on the appropriateness of models and inferences made from models based on the data at hand requires understanding of statistical and computational methods.
2.1.4 Data-Centric Artifacts and Applications
Answers to questions derived from data are usually shared and published in meaningful, succinct but sufficient, reproducible artifacts (papers, books, movies, comics). Going a step further, interactive applications that let others explore data, models and inferences are great.
2.2 Why Data Science?
The granularity, size and accessibility data, comprising both physical, social, commercial and political spheres has exploded in the last decade or more.
“I keep saying that the sexy job in the next 10 years will be statisticians”
Hal Varian, Chief Economist at Google (http://www.nytimes.com/2009/08/06/technology/06stats.html?_r=0)
“The ability to take data—to be able to understand it, to process it, to extract value from it, to visualize it, to communicate it—that’s going to be a hugely important skill in the next decades, not only at the professional level but even at the educational level for elementary school kids, for high school kids, for college kids.”
“Because now we really do have essentially free and ubiquitous data. So the complimentary scarce factor is the ability to understand that data and extract value from it.”
Hal Varian (http://www.mckinsey.com/insights/innovation/hal_varian_on_how_the_web_challenges_managers)
2.3 Data Science in Society
Because of the large amount of data produced across many spheres of human social and creative activity, many societal questions may be addressed by establishing patterns in data. In the humanities, this can range from unproblematic quesitions of how to dissect a large creative corpora, say music, literature, based on raw characteristics of those works, text, sound and image. To more problematic questions, of analysis of intent, understanding, appreciation and valuation of these creative corpora.
In the social sciences, issues of fairness and transparency in the current era of big data are especially problematic. Is data collected representative of population for which inferences are drawn? Are methods employed learning latent unfair factors from ostensibly fair data? These are issues that the research community is now starting to address.
In all settings, issues of ethical collection of data, application of models, and deployment of data-centric artifacts are essential to grapple with. Issues of privacy are equally important.
2.4 Course Organization
This course will cover basics of how to represent, model and communicate about data and data analyses using the R data analysis environment for Data Science.
The course is roughly divided into five areas:
- Area 0: tools and skills
○ Toolset (Rstudio/tidyverse/rmarkdown)
○ Best practices
○ Debugging data science
- Area I: types and operations
○ Data tables and data types
○ Operations on tables
○ Basic plotting
○ Tidy data / the ER model
○ Relational Operations
○ SQL
○ Advanced: other data models, db consistency and concurrency
- Area II: wrangling
○ Data acquisition (load and scrape)
○ EDA Vis / grammar of graphics
○ Data cleaning (text, dates)
○ EDA: Summary statistics
○ Data analysis with optimization (derivatives)
○ Data transformations
○ Missing data
- Area III: modeling
○ Univariate probability and statistics
○ Hypothesis testing
○ Multivariate probablity and statistics (joint and conditional probability, Bayes thm)
○ Data Analysis with geometry (vectors, inner products, gradients and matrices)
○ Linear regression
○ Logistic regression
○ Gradient descent (batch and stochastic)
○ Trees and random forests
○ K-NN
○ Naïve Bayes
○ Clustering
○ PCA
- Area IV: essential applications
○ Text mining
○ Graphs
○ Forecasting
- Area V: communication
○ Designing data visualizations for communication not exploration
○ Interactive visualization
○ Writing about data, analysis, and inferences
2.5 General Workflow
The data science activities we will cover are roughly organized into a general workflow that will help us navigate this material (Figure from Zumel and Mount).
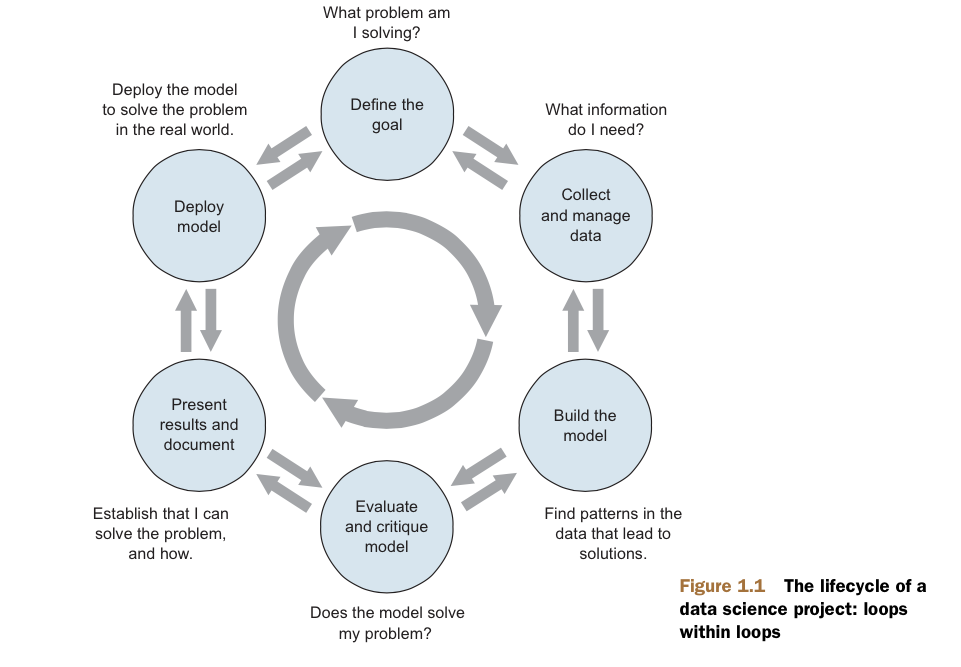
2.5.1 Defining the Goal
- What is the question/problem?
- Who wants to answer/solve it?
- What do they know/do now?
- How well can we expect to answer/solve it?
- How well do they want us to answer/solve it?
2.5.2 Data Collection and Management
- What data is available?
- Is it good enough?
- Is it enough?
- What are sensible measurements to derive from this data? Units, transformations, rates, ratios, etc.
2.5.3 Modeling
- What kind of problem is it? E.g., classification, clustering, regression, etc.
- What kind of model should I use?
- Do I have enough data for it?
- Does it really answer the question?
2.5.4 Model Evaluation
- Did it work? How well?
- Can I interpret the model?
- What have I learned?
2.5.5 Presentation
- Again, what are the measurements that tell the real story?
- How can I describe and visualize them effectively?
2.5.6 Deployment
- Where will it be hosted?
- Who will use it?
- Who will maintain it?