Measuring DNA methylation and understanding role in expression regulation in solid tumors
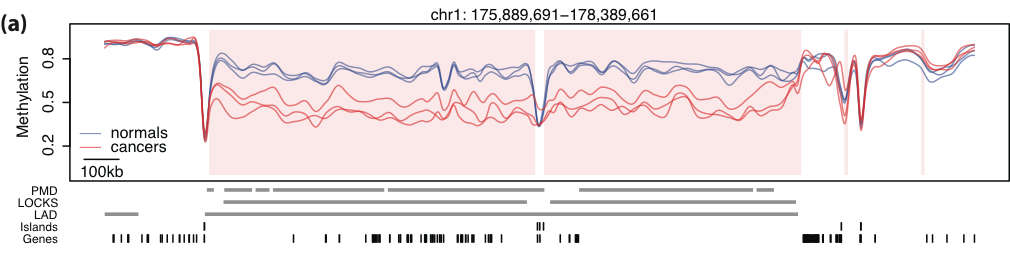
Large blocks of hypo-methylation (sometimes Mbps long) in colon cancer
Héctor Corrada Bravo (@hcorrada, hcorrada@umiacs.umd.edu)
Center for Bioinformatics and Computational Biology, University of Maryland
Measuring DNA methylation and understanding role in expression regulation in solid tumors
Large blocks of hypo-methylation (sometimes Mbps long) in colon cancer
Measuring DNA methylation and understanding role in expression regulation in solid tumors
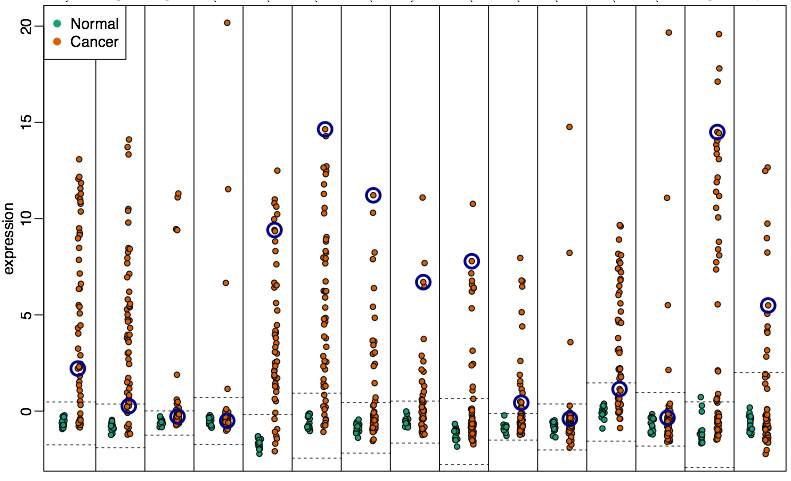
Hyper-variable genes are enriched within these blocks.
Measuring DNA methylation and understanding role in expression regulation in solid tumors
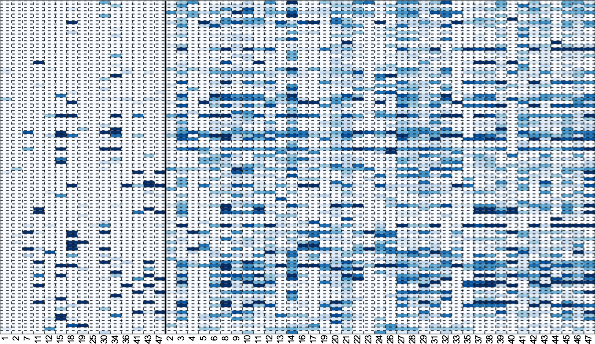

Consistently hyper-variable genes are tissue-specific.

Bsmooth, minfi)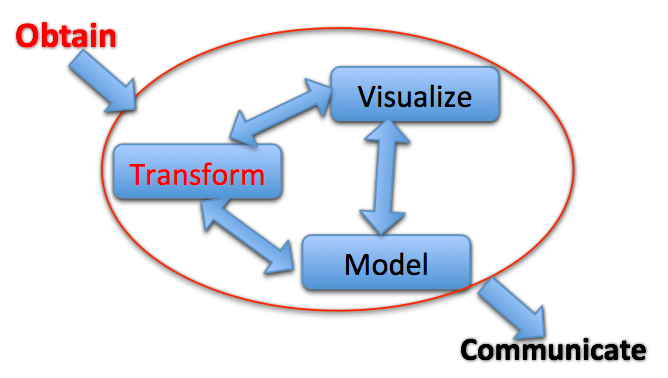

epivizr packageI want to use a genome browser track as a display device in R!!
Plug-in data from R with epivizr package
Workspaces and filtering
Data transformations and customization
More transformations and aggregation
Add new visualizations
Using the epivizr package
epivizr sessionmgr <- startEpiviz(workspace="qyOTB6vVnff")
# Get tumor methylation base-pair data
m <- assay(se)[,"tumor"]

# Compute regions with highest variability across cpgs
region_stat <- calcWindowStat(m, step=25, window=80, stat=rowSds)
s <- region_stat[,"stat"]
Using the epivizr package: browse by regions of interest.
# get locations in decreasing order
o <- order(s, decreasing=TRUE)
indices <- region_stat[o, "indices"]
slideShowRegions <- rowRanges(se)[indices] + 1250000L
mgr$slideshow(slideShowRegions)
epivizruses WebSockets for connection, same asshiny. Big, big, big thanks to the @rstudio folks for working on this infrastructure.
Statistically informed visual exploration
epivizr BioC package)library(epivizr)
library(Mus.musculus)
mgr <- startStandalone(geneInfo=Mus.musculus, geneInfoName="mm10",
keepSeqlevels=paste0("chr",c(1:19,"X","Y")))
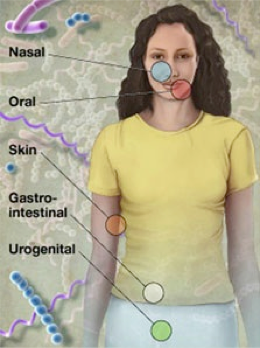
Coordinates:
Samples:
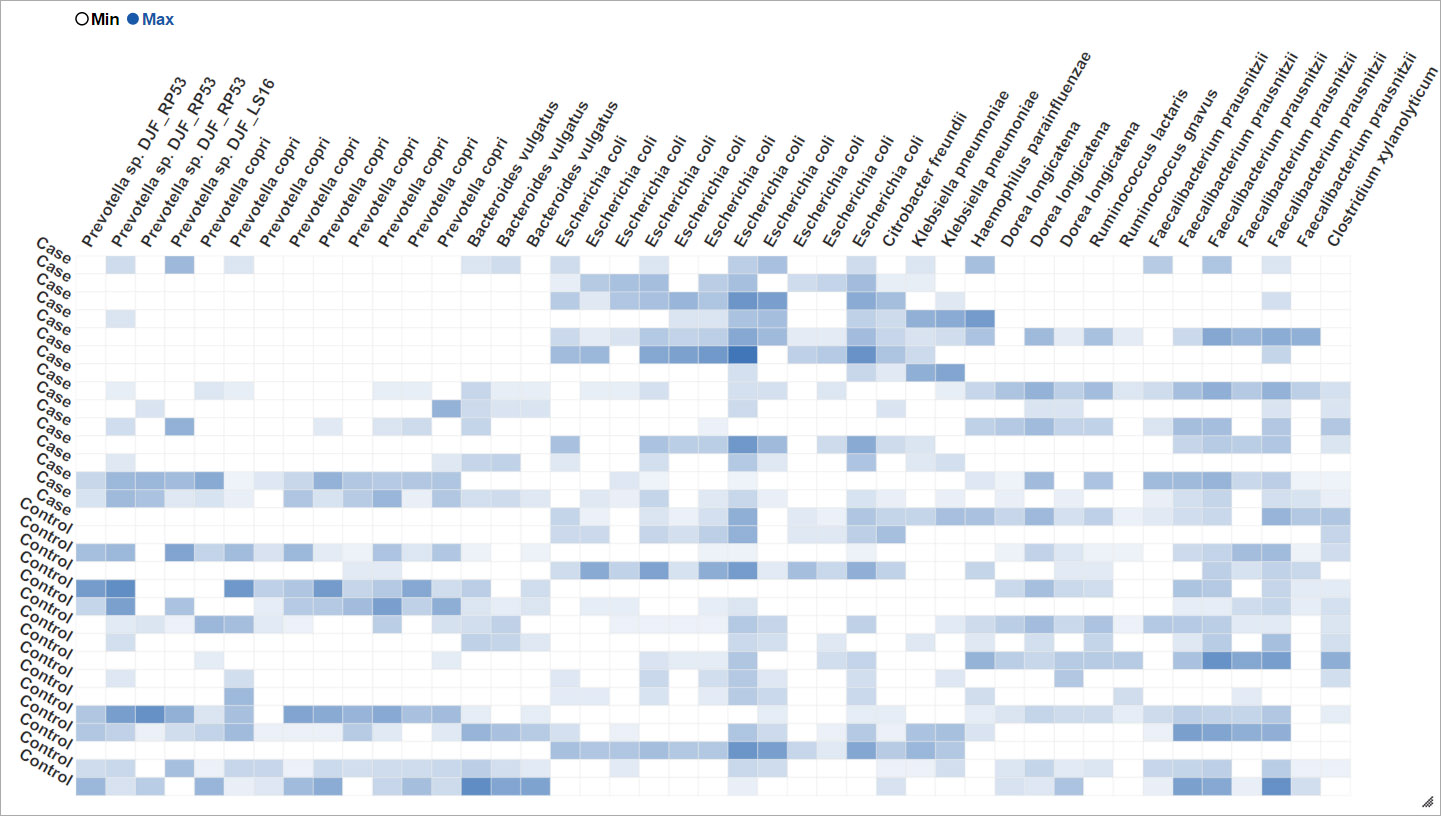
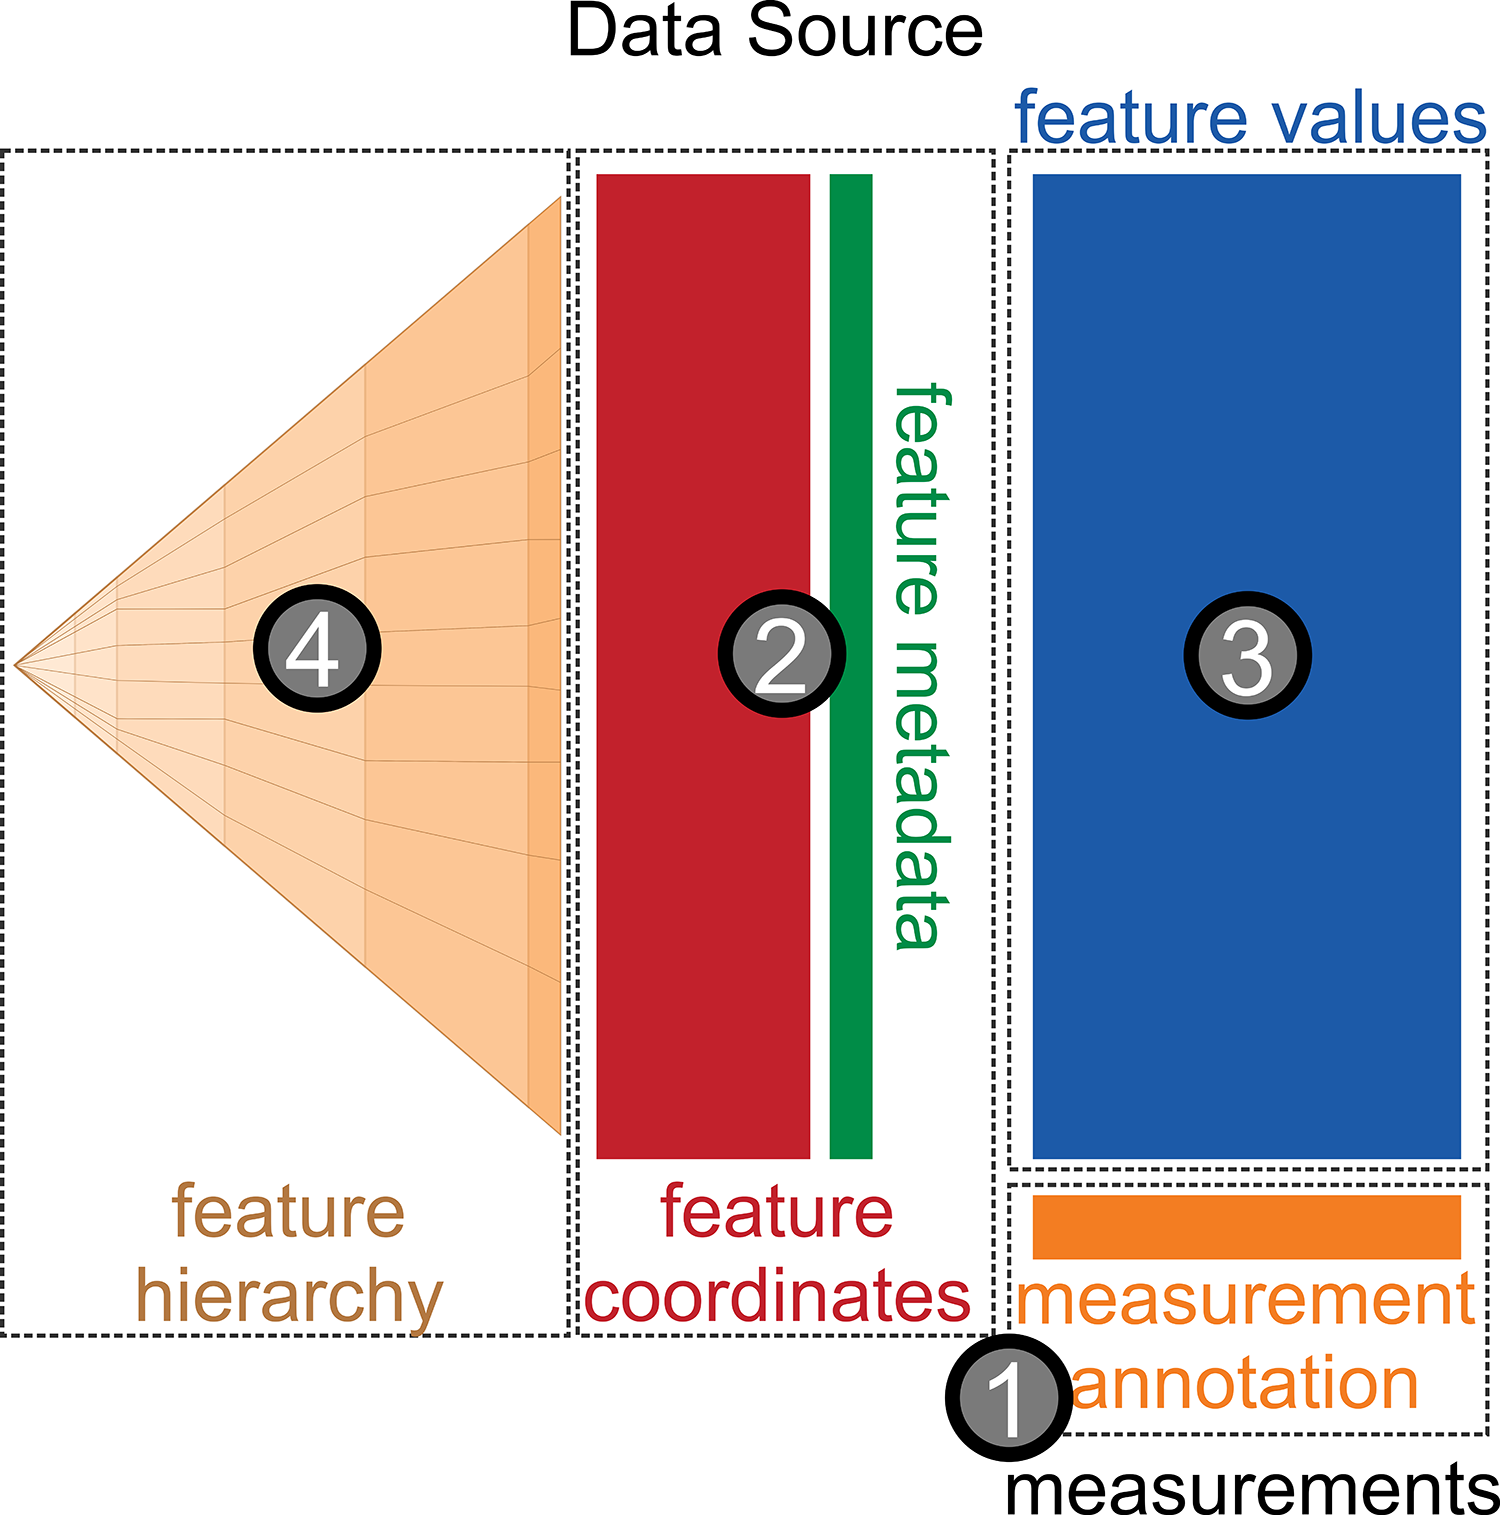
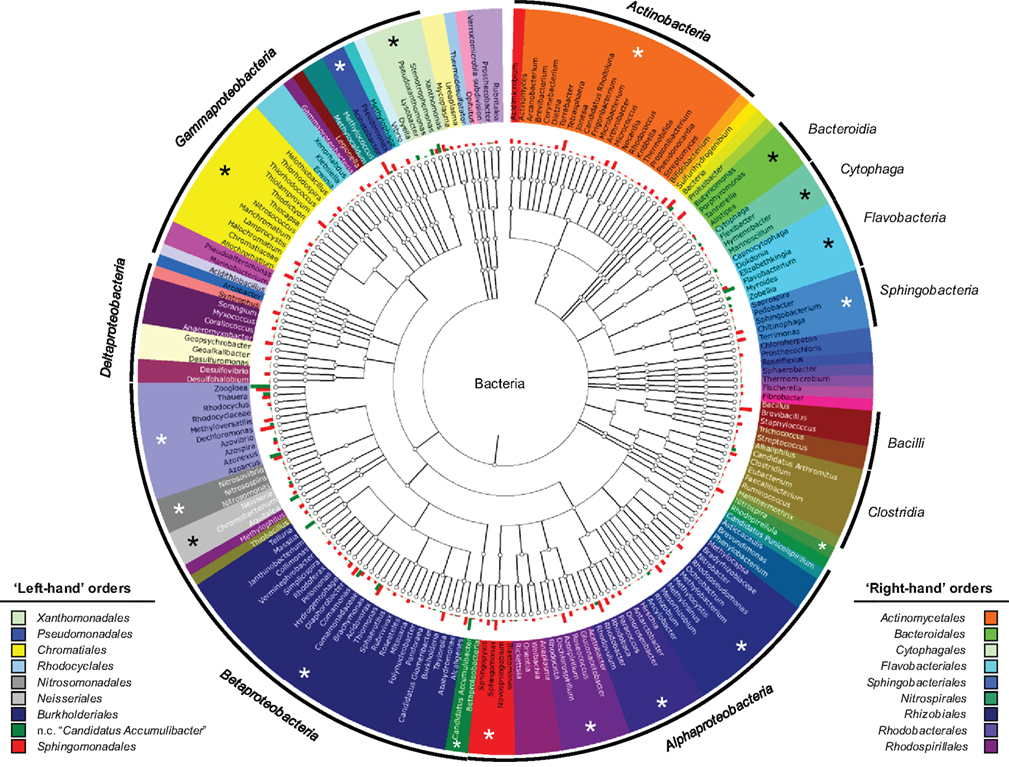
Hierachically organized features
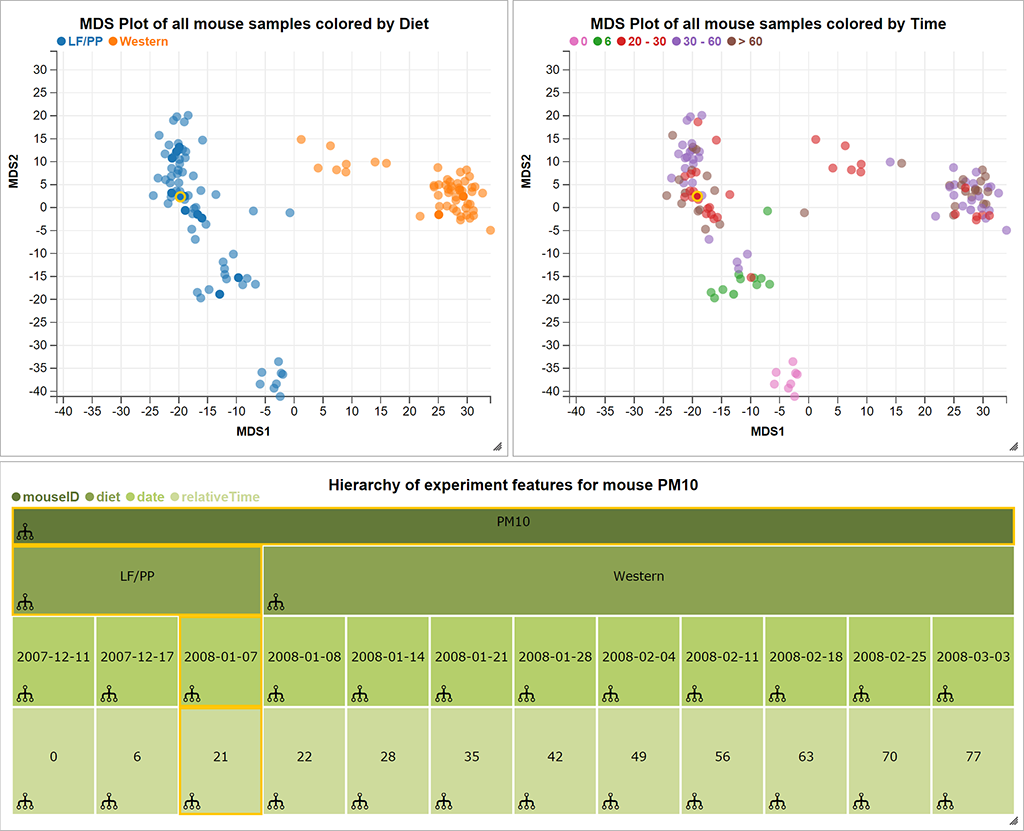
Built with epivizr and metagenomeSeq
One interpretation of Big Data is Many relevant sources of contextual data
One interpretation of Big Data is Many relevant sources of contextual data
We are building a software system to support creative exploratory analysis of epigenome-wide datasets...
 Florin Chelaru, UMD
Nature Methods 2014
Follow us: @epiviz
These slides available: http://hcorrada.github.io/ismb2015
Me: @hcorrada, hcorrada@umiacs.umd.edu
www.cbcb.umd.edu/~hcorrada