Measuring DNA methylation and understanding role in expression regulation in solid tumors
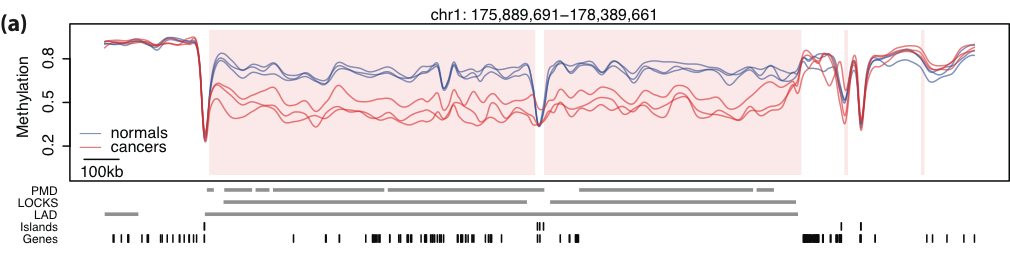
Large blocks of hypo-methylation (sometimes Mbps long) in colon cancer
Hector Corrada Bravo
Center for Bioinformatics and Computational Biology, University of Maryland
Measuring DNA methylation and understanding role in expression regulation in solid tumors
Large blocks of hypo-methylation (sometimes Mbps long) in colon cancer
Measuring DNA methylation and understanding role in expression regulation in solid tumors
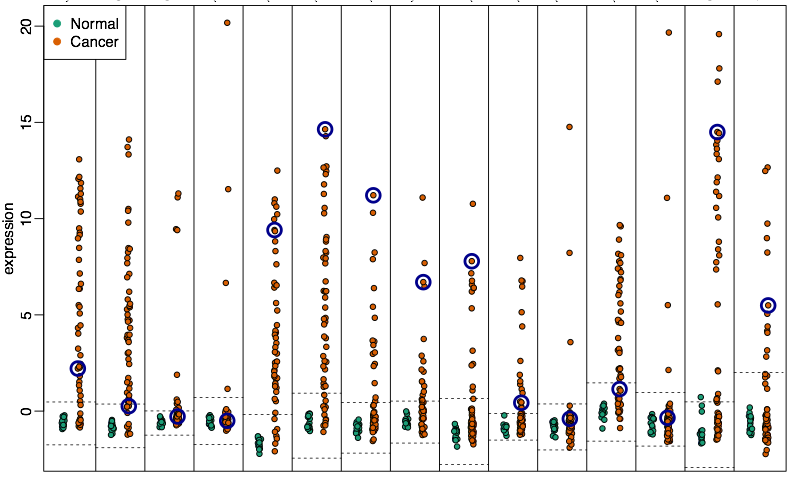
Hyper-variable genes are enriched within these blocks.
Measuring DNA methylation and understanding role in expression regulation in solid tumors

Consistently hyper-variable genes are tissue-specific.
Measuring DNA methylation and understanding role in expression regulation in solid tumors
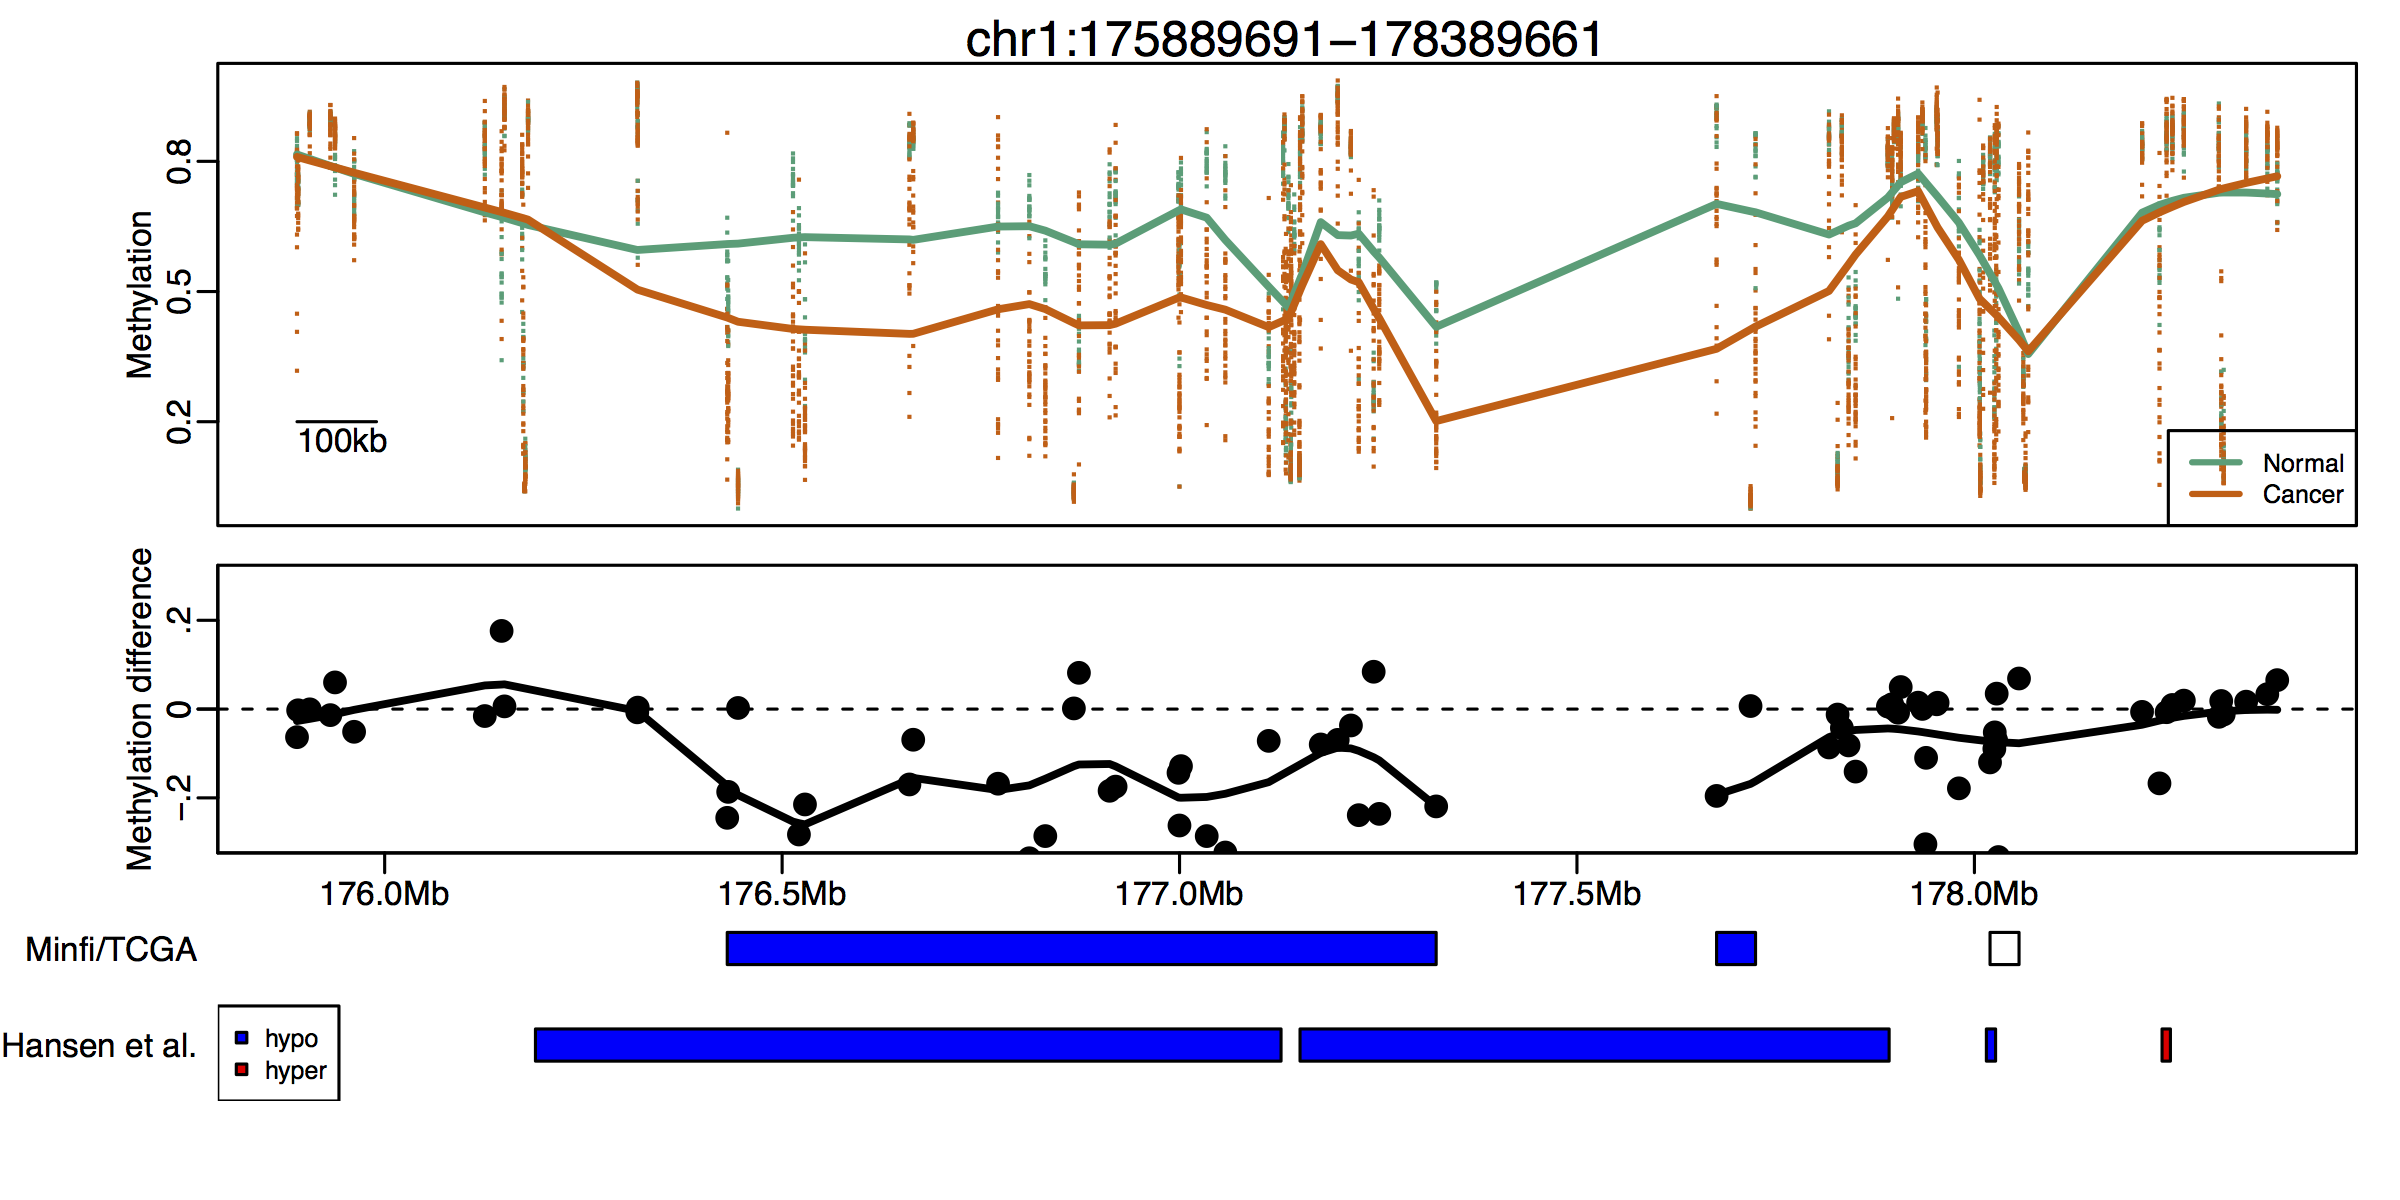
Blocks can be detected using Illumina bead arrays.
Measuring DNA methylation and understanding role in expression regulation in solid tumors
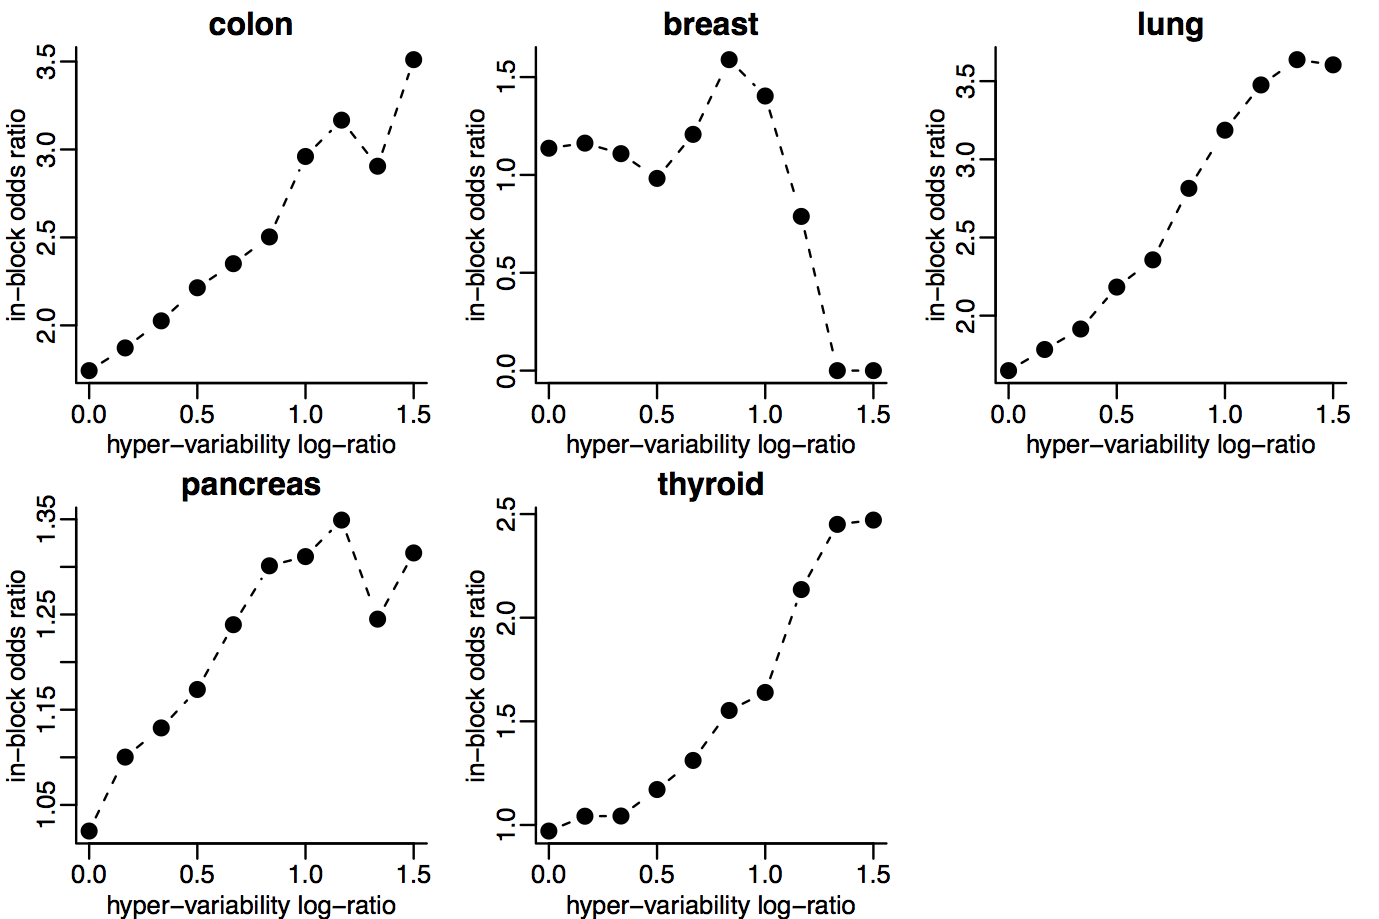
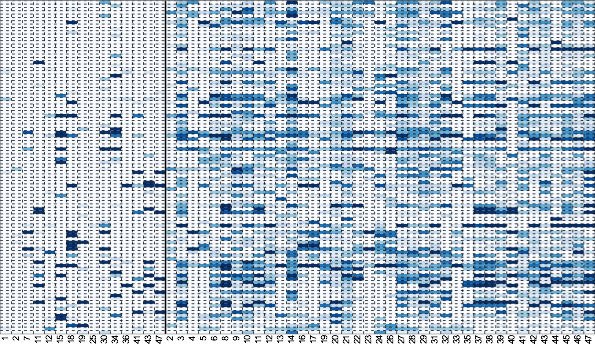
Hyper-variability is enriched within hypo-methylation blocks

Bsmooth, minfi)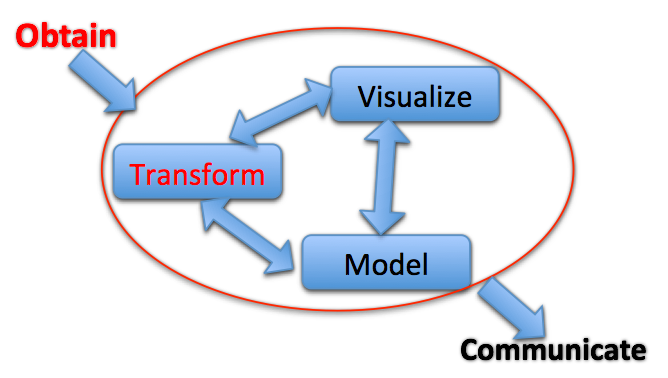

epivizr packageI want to use a genome browser track as a display device in R!!
Plug-in data from R with epivizr package
Workspaces and filtering
Data transformations and customization
Navigate and annotate
Transformations and Aggregation
Add new visualizations
Statistically informed visual exploration
Reproduce, disseminate and collaborate
Using the epivizr package
epivizr sessionmgr <- startEpiviz(workspace="qyOTB6vVnff")
GRanges datablocks_dev <- mgr$addDevice(colon_blocks, "450k blocks")
keep <- width(colon_blocks) > 250000
mgr$updateDevice(blocks_dev, colon_blocks[keep,])
Using the epivizr package: browse by regions of interest.
o <- order(-width(colon_blocks))
slideShowRegions <- colon_blocks[o[1:5],]
slideShowRegions <- slideShowRegions + 1e5
mgr$slideshow(slideShowRegions)
epivizruses WebSockets for connection, same asshiny. Big, big, big thanks to the @rstudio folks for working on this infrastructure.
Our architecture is dynamically extensible. We can easily integrate new data types and add new visualizations.
Example: adding a new visualization
epivizr)library(epivizr)
library(Mus.musculus)
mgr <- startStandalone(geneInfo=Mus.musculus, geneInfoName="mm10",
keepSeqlevels=paste0("chr",c(1:19,"X","Y")))
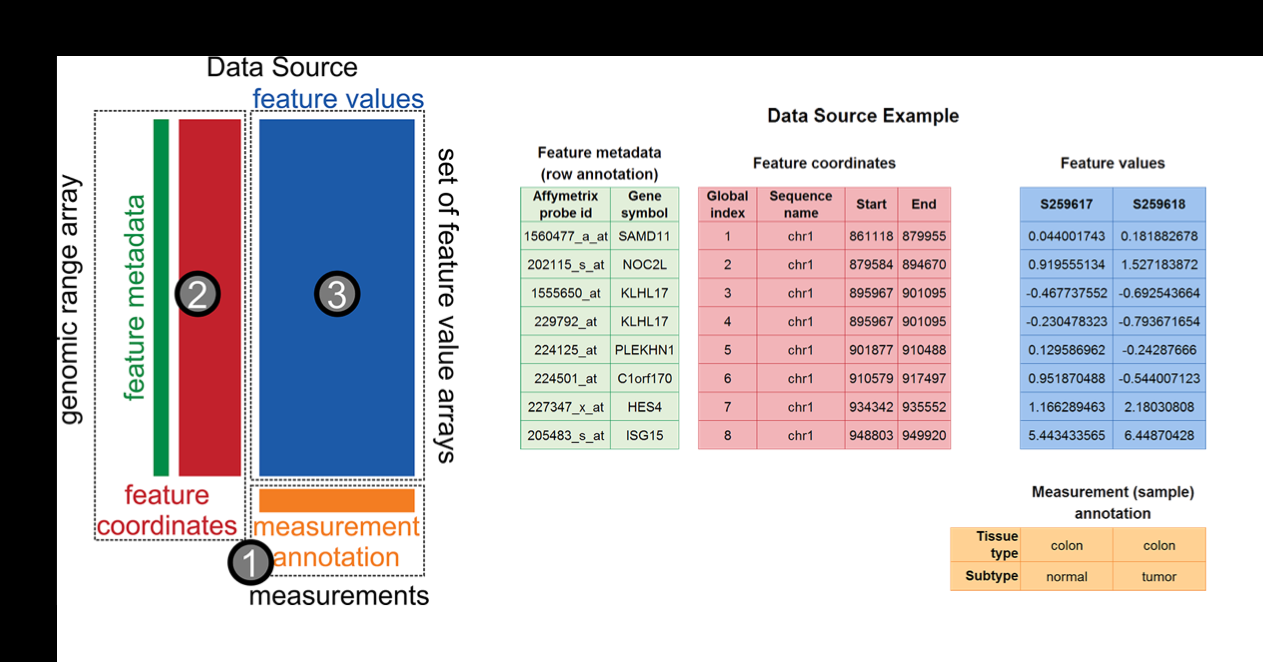
One interpretation of Big Data is Many relevant sources of contextual data
One interpretation of Big Data is Many relevant sources of contextual data
We are building a software system to support creative exploratory analysis of epigenome-wide datasets...
 Florin Chelaru, UMD
Nature Methods 2014
Follow us: @epiviz
These slides available: http://hcorrada.github.io/bioit_world2015